The new Blitz Diagnostics utility, released in version 4.10.0, helps you better understand how your site’s cached content is structured, allowing you to optimise the caching strategy and overall performance of your site.

One of the issues that often comes up when using Blitz, especially in content-heavy sites with lots of relationships, is that a suboptimal content structure can lead to a content editing experience that feels sluggish. The main culprit is when an element is referenced (tracked) by lots of cached pages.
Blitz ensures that every cached page tracks both the elements it outputs, as well as the element queries that were executed to fetch those elements. This can lead to the common issue noted in the docs, the entire cache is refreshed when only one entry is updated. Some issues are relatively easy to troubleshoot, for example when an entry is referenced in a navigation bar that appears on every page on the site. But others aren’t.
The new Blitz Diagnostics utility allows you to see what pages, query strings, elements and element queries are being tracked, giving you opportunities to optimise your caching strategy.
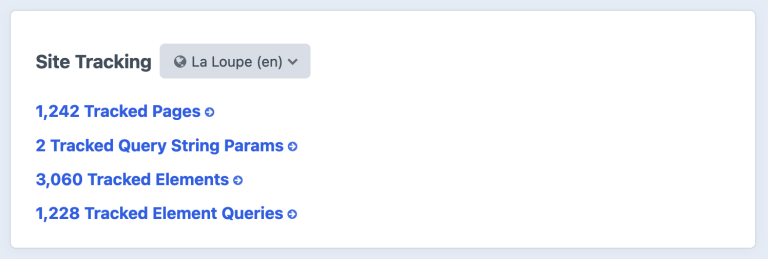
Tracked Pages #
The Blitz Diagnostics utility shows us exactly what pages are cached, as well as the number of elements and element queries that each of them tracks.

This is powered by Sprig, making it fast, searchable and sortable.
In the example above, we can see that the map page tracks 408 elements, likely because it outputs a large number of elements on a map. Additionally, each unique destination query string param value is cached and also tracks a large number of elements.
Drilling into each page, we can see the elements and element queries it tracks, grouped by element type.

We can even view every element that each page tracks.

Tracked Query String Params #
We can see what query string params are included in cached page URIs and how many pages each is used on.

This allows us to audit whether things are set up correctly in the advanced Blitz settings. If, for example, we had unexpected query string params such as xyz then would adjust the “Included Query String Parameters” setting accordingly. By default, all query string params are allowed, as indicated by the wildcard .*. For the example above, it made sense to limit the allowed query string params to only topic and destination.
For each query string param, we can drill into the cached pages that use it.

Tracked Elements #
We can see how many elements are tracked, grouped by element type.

And, as you might expect, for each element we can see how many pages track it.

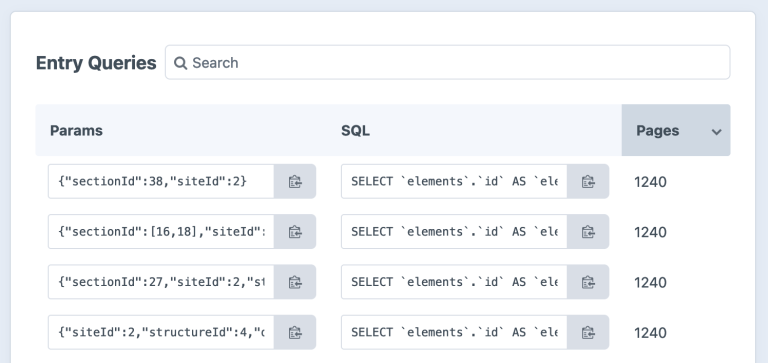
Tracked Element Queries #
We can see how many element queries are tracked, also grouped by element type.

And, finally, for each element query, we can see how many pages track it. The raw SQL command for each element query can be copied and executed, for analysis.
Conclusion #
A better understanding of how your site’s cached content is structured can help you make adjustments and improvements to your site’s performance and the content editing experience. Blitz Diagnostics will not tell you what to do, but it will give you insight into what’s going on behind the scenes, and that is the first step in putting a better caching strategy in place.