If like me you sell your ExpressionEngine add-ons on devot-ee then you are definitely familiar with the sales reports page. It gives a quick overview and tabular report of the selected month’s sales. But if you want to properly analyse your sales then you simply need to visualise them. I’ve written a small php script to do just that and frankly I’ve surprised myself with how insightful it is.
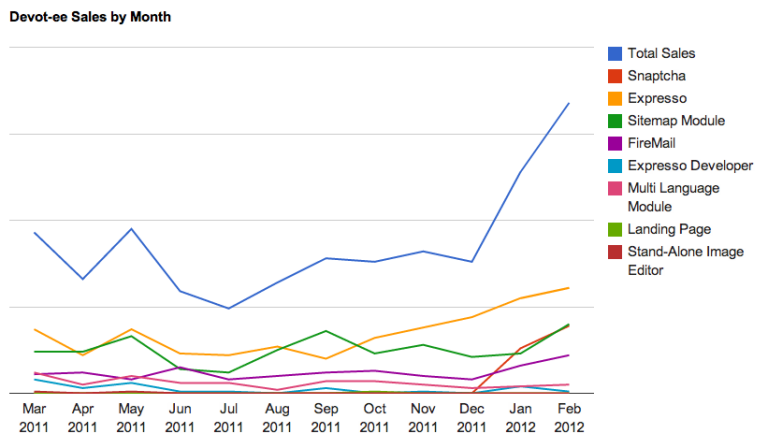
By default the script shows number of sales per add-on per month.
Changing a setting in the script displays the amount of income per add-on per month.
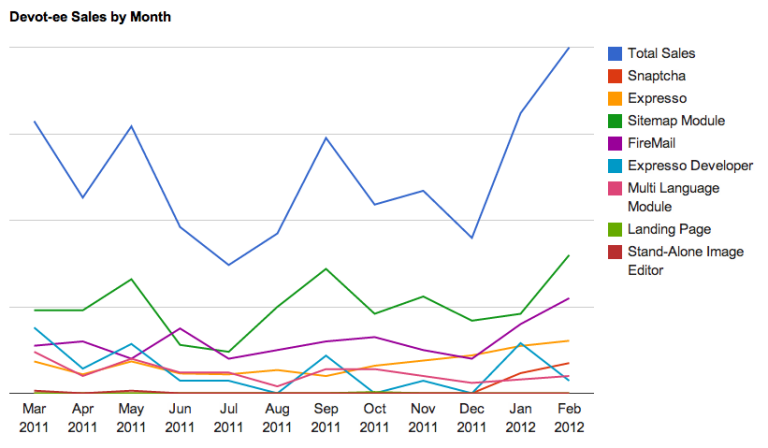
I find the comparison between these two graphs fascinating. Although Expresso sells more than any other add-on, the Sitemap Module (at $30 more) is by far the highest earner. And although the number of sales has skyrocketed since the start of 2012, the amount of income has not risen nearly as dramatically (note that I have hidden the exact figures in the screenshots above).